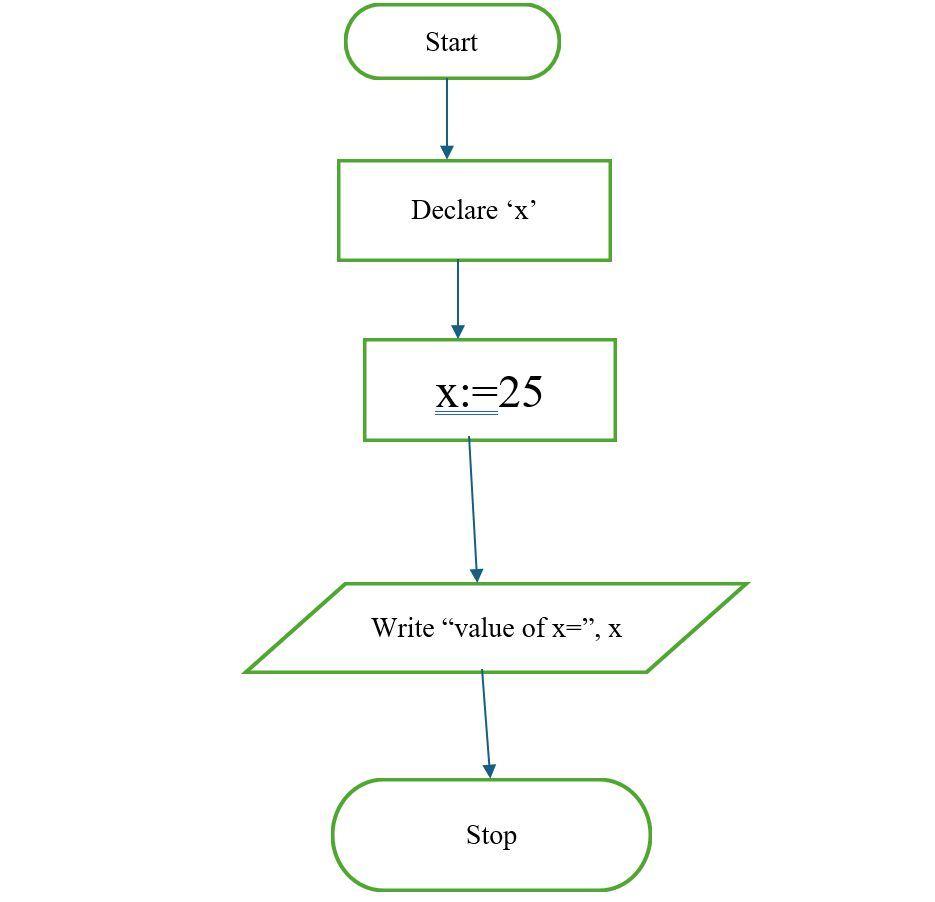
Flow Chart is a pictorial representation of the algorithm that helps to understand how the flow of program execution is moving on. It enhances the understanding of program and useful to rectify errors.
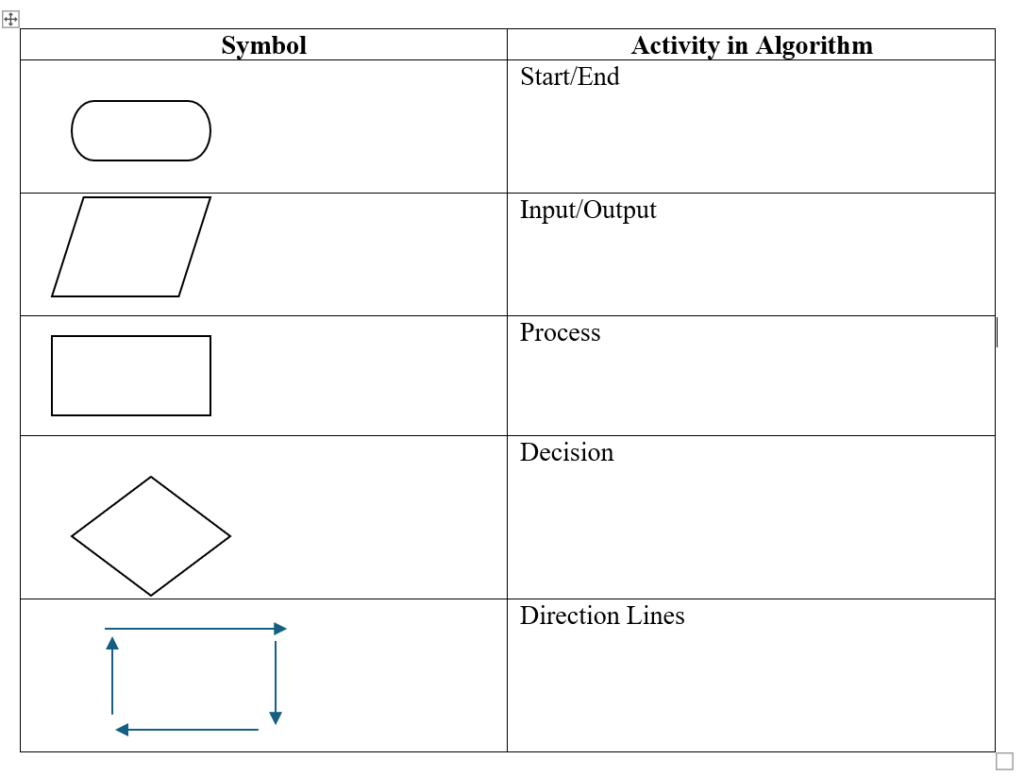
It is used to represent different activities of the algorithm using graphics. The following are the activities of an algorithm:
Start and stop
Input and output
Process
Decision making
Direction or flow lines
Flowchart Symbols:
While selecting symbol for flow chart we should in the perspective of the computer since it is the executor of the program.